Trading Trend Continuation vs Reversal Chart Patterns
Ultima Markets guide: Master trend patterns. Trade flags, pennants, reversals. Combine strategies for success. Improve your trading game now!

Key Takeaways:
- Identify larger trends before attempting to trade chart patterns to avoid mistaking reversals for continuations
- Use volume confirmation for better sense of breakout sustainability and legitimacy
- Wait patiently for pattern completion before entering trades to avoid false signals
- Set initial stops outside patterns to allow price action to trigger exits automatically
- Scale out winners strategically by trailing stops to lock in some profits as trade moves favorably
Introduction to Trend Continuation and Reversal Chart Patterns
Chart patterns are structures that form in price charts over a period of time that signal potential future price movement once completed. They are important trading tools that technicians use to identify shifts in supply and demand and execution entry and exit points.
There are two main types of chart patterns:
- Trend continuation patterns: These signal that the current trend is likely to resume. They imply that despite a brief period of consolidation or counter move, market participants agree on further movement in the same direction once the pattern completes. Examples include flags, pennants, and triangles.
- Reversal patterns: These signal that the ongoing trend is likely to reverse upon completion of the pattern. They show disagreement among market players and a shift in supply/demand. Examples include head and shoulders tops/bottoms and double tops/bottoms.
Identifying whether a market is in an uptrend, downtrend or range bound area is key for determining if emerging chart patterns are signaling continuation or reversal. Getting this wrong can lead to entering poor trades.
Some key benefits of trading chart patterns include:
- They appear frequently across all markets and timeframes
- They have defined structures that technical analysts can recognize
- Risk and reward ratios can be planned in advance
In the next section, we will take a deeper look at trend continuation chart patterns, how to identify them and tips for successfully trading them.
Trend Continuation Chart Patterns
Trend continuation patterns are formations that signal the current trend is likely to resume after a brief period of consolidation or counter-trend move. They imply that market participants agree further movement will occur in the direction of the previous trend.
Some of the most common trend continuation chart patterns include:
- Flags
- Pennants
- Ascending/Descending triangles
The key benefit of trading continuation patterns is increased confidence that momentum will carry in the direction of the prevailing trend once the pattern completes.
How to Trade Trend Continuation Patterns
There are some general guidelines to follow when trading all continuation chart patterns:
- Identify an established trend by drawing trendlines and determining clear higher highs/lows
- Wait for a pattern to form near the trendline showing reduced volatility
- Place entry order just above or below the pattern in the direction of trend
- Use pattern height to set initial profit target
- Set stop loss below or above the pattern
Tips for Setting Entry and Exit Points
When fine tuning entry and exit levels, it can help to:
- Draw key support and resistance zones around the pattern
- Identify candlestick signals closing outside pattern borders
- Use other indicators like volume to confirm momentum
- Trail stops wider once in profit
Applying good risk management is vital for dealing with inevitable losing trades. Ideal risks reward ratios for flags and pennants is usually 1:2 or more.
Let’s break down flags and pennants in more detail.
Flag Pattern
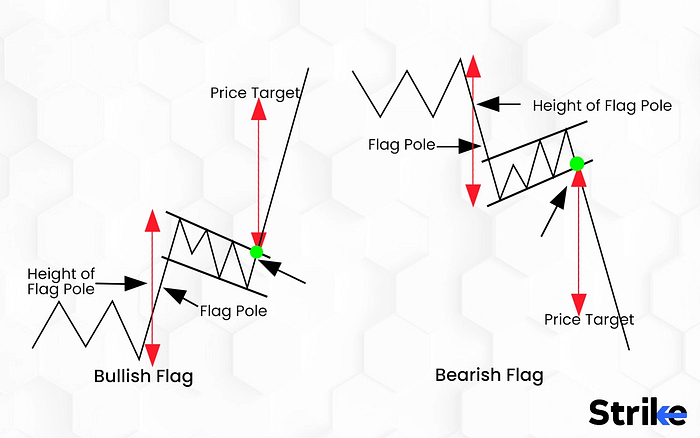
The flag pattern gets its name because it resembles a flag on the chart. It occurs as a period of contained movement within parallel trendlines that slope against the previous trend.
Structure and Typical Shape
Flags have the following characteristics:
- They form after a sharp rise or decline with heavy volume (flag pole)
- Consist of a rectangular or channel pattern showing less volatility
- Pole formed by the trend can be used to estimate future price target
Flags are usually inclined in the opposite direction of the previous trend:
- Uptrends see flags inclined downwards
- Downtrends have flags inclined upwards
How to Identify and Draw Trendlines
Properly identifying flags involves:
- Drawing the flag pole measuring the volume spike and price run-up
- Connecting the highs or lows of the consolidation to draw parallel trendlines
- Ensuring pole and flag are in the correct orientation to the trend
Entry and Exit Point Placement Strategies
The textbook entry for flags is similar to other continuation patterns:
- Enter long trades just above resistance trendline or near high of flag pole area
- Enter short trades just below support trendline or low of flag pole area
Exit positions once price crosses out of the flag structure itself, either via trailing stops or targets based on the flag pole’s advance. More aggressive traders may ignore breaking flag trendlines and stick with overall trend direction. Exiting once a candle closes fully outside flag is a common criteria.
Here are some examples of flag chart patterns and typical entry strategies:
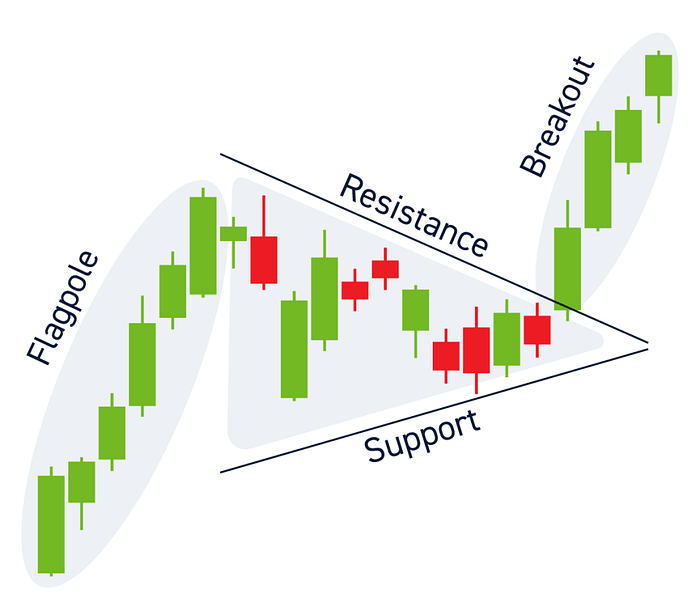
Pennant Pattern
The pennant is another common continuation pattern similar to flags. It features a contracting triangle shape rather than a rectangular channel.
Structure and Typical Shape
Pennants have these characteristics:
- They are small symmetrical triangles that form after a strong price movement
- The triangles feature a tapering body, like a pennant on a flag pole
- They demonstrate decreasing volatility as they develop
Key Differences vs Flag Patterns
While pennants and flags are both continuation patterns, pennants have some unique features:
- Pennants appear more frequently in very short time frames under an hour
- The pattern lasts shorter than most flags, often under 10 periods
- Breakouts from pennants can evolve faster than flags
Strategies for Trading Entry and Exit Points
Pennants and flags have similar trading strategies but pennant’s faster development means:
- Having entry orders closer to pattern is advised
- Tighter stops are recommended over lagging exits
- Targets may be smaller due to shorter preceding trend
Despite their brief existence, pennants remain a trading favorite due to their tendency to resolve cleanly in the direction flagged by the previous move.
Here is an example of a bullish pennant formation:
Reversal Chart Patterns
Unlike continuation patterns, reversal chart patterns signal that the ongoing trend is likely to change direction after completion of the pattern. They indicate disagreement among market participants and a shift in supply/demand dynamics.
Some of the most common reversal patterns include:
- Head and shoulders tops/bottoms
- Double tops
- Double bottoms
- Wedges
How to Trade Reversal Patterns
There are some general guidelines for trading all reversal formations:
- Identify existing trend and look for patterns signaling exhaustion
- Confirm pattern completion with break of key support/resistance
- Enter trades in opposite direction once reversal is confirmed
- Set initial targets based on pattern’s structure
- Place protective stops below/above recent swing points
Proper identification of support and resistance is key for trading reversals successfully.
Next we will examine two of the most popular and reliable reversal chart patterns: head and shoulders and double tops/bottoms.
Head and Shoulders Pattern
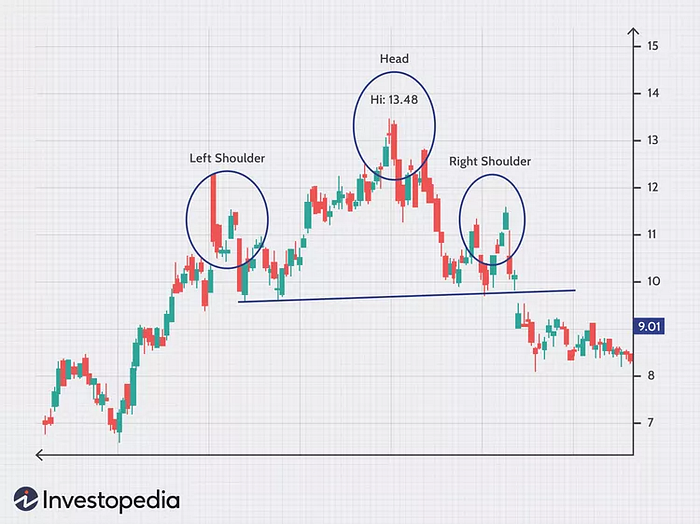
The head and shoulders pattern is a powerful and common reversal formation that tends to develop at market tops and bottoms.
Structure and Rules for Spotting
Head and shoulders have a defined structure:
- Left shoulder — Price rise followed by minor retracement
- Head — Another rally with new high/low formed
- Right shoulder — Price pushes upward but fails to reach high
- Neckline — Connects lowest points of formation
There are clear rules for confirming a head and shoulders:
- Shoulders do not achieve the height of the head
- Volume is highest on the head
- Neckline break on heavy volume signals reversal
Trading the Breakout from Neckline
The neckline breakout triggers entry:
- Enter shorts on downward break of neckline after head & shoulders top
- Enter longs on upward break of neckline after head & shoulders bottom
Initial stop loss placed slightly above or below the opposing shoulder.
Setting Profit Targets and Stop Loss
Upside/downside price targets can be projected by taking height of overall pattern from head to neckline and extrapolating.
Stop loss moves to breakeven once price hits initial target. Second target can be 2x pattern height.
Here is an example head and shoulders top signaling a reversal:
Double Top/Bottom Patterns
Double tops and bottoms are another common reversal formation, signaling a shift in the ongoing trend.
Structure and Confirmation Rules
Double tops/bottoms have a defined shape:
- Price hits a level twice forming two swing points
- Pullback/bounce occurs in between swing points
- Break of support/resistance in between confirms reversal
Trading Entry and Exit Strategies
Entry strategy rules include:
- Enter shorts on downward break for double top pattern
- Enter longs on upward break for double bottom pattern
- Place initial stop just above/below breaking support/resistance
Pros and Cons of Double Tops vs Bottoms
Though similar formations, some key differences exist:
Double Tops
- Tend to form more frequently as market tops
- Often retest breakout level
- Initial targets are often hit
Double Bottoms
- Less frequent than double tops
- Breakouts tend to stick immediately
- Bottoms produce returns faster
Comparing Continuation vs Reversal Patterns
Now that we have covered both trend continuation and reversal formations, what are some of the major similarities and differences between them?
Key Similarities
Both continuation and reversal chart patterns share common traits like:
- Clear structures technicians can recognize
- Reduced volatility setting up breakout moves
- Ability to use pattern height/width to project targets
Differences Between the Two
However, some notable differences include:
- Continuation forms in direction of existing trend, reversal against trend
- Trading continuation focuses on resuming trend, trading reversal bets on new trend
- Continuation provides confirmation from existing momentum
Which is Easier to Trade?
In general, trading continuation patterns tends to have a higher probability of success. Reasons include:
- Existing trends carry inertia making continued movement more likely
- False breakouts are less frequent compared to reversals
- Stops are more logically placed in the counter-trend direction
However, heavily traded reversal patterns like head and shoulders still produce favorable risk-reward ratios.
Combining With Other Strategies
Using other indicators can augment success rates for both continuation and reversal trades. Common complementary tools include:
- Volume to confirm breakouts
- Momentum oscillators like RSI to identify extremes
- Other pattern analysis like wedge, channel breaks
Tips for Successfully Trading Chart Patterns
Here are some final best practices for trading continuation and reversal chart patterns:
1) Use Correct Stop Losses and Risk Management
- Place initial stops just outside the pattern structure
- Trail stops to lock in profits as trade moves favorably
- Move to breakeven once price hits the initial target
- Ideal risk-reward for patterns is at least 1:1.5 ratio
2) Backtest Pattern Strategies
- Trade on demo account to gauge typical success rate
- Note whether targets based on pattern height are realistic
- Tweak entry/exit criteria to optimize performance
3) Focus on High Probability Setups
- Trade patterns demonstrating clear definition criteria
- Ensure volume aligns properly with formation
- Enter only in direction of new trend once breakout confirmed
4) Track Stats to Improve Over Time
- Log details of each pattern trade in a journal
- Record pattern type, result, duration, and more
- Periodically analyze stats to refine approach
Proper analysis and execution of chart patterns can produce favorable results over time. However, no analysis method is perfect. Maintaining discipline according to a strategic plan based on backtesting and metrics will help improve odds of success.
Conclusion and Final Tips
In this comprehensive guide, we covered all the major types of trend continuation and reversal chart patterns including flags, pennants, head and shoulders, and double tops/bottoms. Here are some key takeaways:
- Identify larger trend context before trading patterns
- Use volume to confirm likelihood of breakouts
- Practice patience for confirmation before entering
- Employ sound risk management with stops and targets
With the right foundation of knowledge, chart patterns can offer reliable signals of future market moves. Just remember to always track the typical performance of patterns in your trading instrument to improve results over time.
Invest with Confidence, Partner with Ultima Markets
Navigating the intricate world of investments can be challenging for both newcomers and seasoned investors. The key lies in finding the right partner — a trusted entity that combines automated investing, active trading, comprehensive research tools, and reliable guidance.
At Ultima Markets, we are here to serve as your ultimate gateway to the world of investing. Our user-friendly platform simplifies smart investing through tailored advisory services, commission-free trades, automated portfolios, and more. Whether you prefer hands-on stock trading or a hands-free approach, we have the solutions you need. Our experienced team is always available to inform your financial decisions for the journey ahead.
Take control of your financial future today by opening an Ultima Markets account. Experience the next generation of investing with our cutting-edge platform, and join the thousands of clients who are already growing their wealth with confidence. Don’t leave your financial future to chance — partner with Ultima Markets, your ultimate gateway to trading success.